
Construction Project Tracking for Developers: Gantt, S-Curve, Site Reports and Cash Flow
How real estate developers can track construction in one project portal: Gantt milestones, an S-curve of planned against actual progress, daily site reports, contractors' certificates, budget against actual and cash flow.
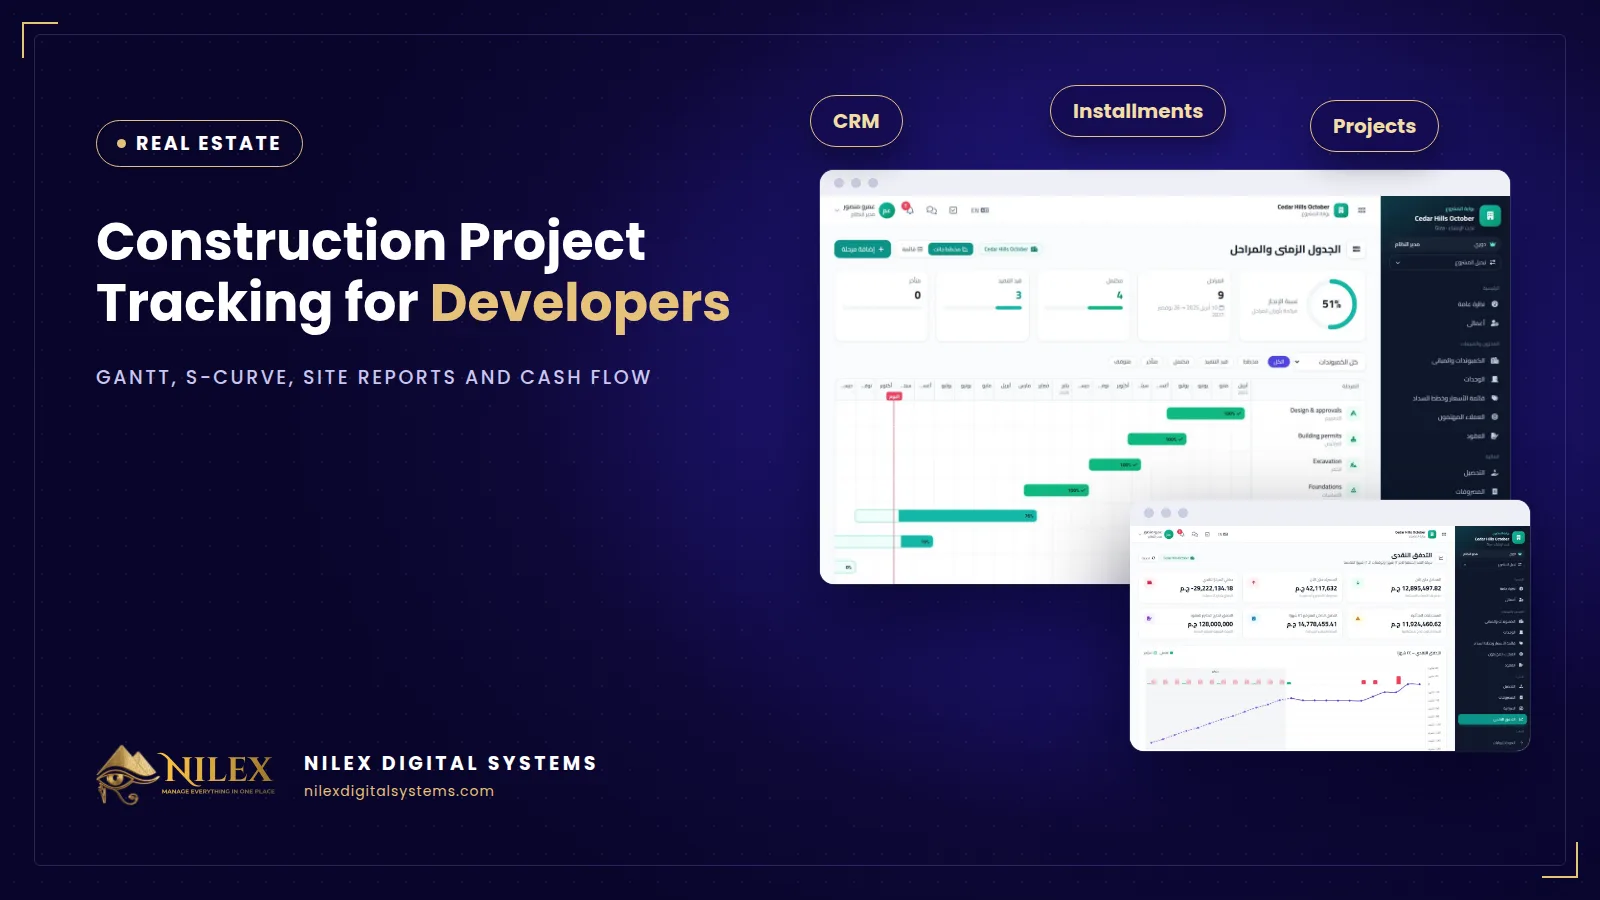
Construction project tracking for a real estate developer means following every project on four lines at once: time (a Gantt timeline of milestones), progress (planned against actual on an S-curve, backed by daily site reports), contractors (their work and payment certificates) and money (budget against actual and a cash flow forecast). When these live in the same system as sales and collections, management can see whether the money coming in from installments will cover what the site needs next month.
Most developers track construction with a project manager's Excel timeline, WhatsApp photos from the site engineer, contractor certificates in a folder and a budget the finance team updates monthly. Each piece is reasonable on its own. Together they leave management asking the same question every month: are we on time, and do we have the cash for the next phase?
Key takeaways
- Every project should have its own portal: timeline, progress, site reports, contractors, budget and cash flow in one place.
- A Gantt timeline shows milestones and dates; an S-curve shows whether cumulative progress is ahead of or behind plan.
- Daily site reports with photos are the evidence behind the progress numbers and behind contractors' certificates.
- Budget against actual should be tracked per item, so overruns show up while there is still time to act.
- A cash flow over the coming months, actual and forecast, links construction spending to the installments sales has already scheduled.
Why give every project its own portal?
A developer with three projects in different phases cannot manage them from one shared file. Each project has its own buildings, units, price list, payment plans, contractors and budget. A project portal gathers all of that: progress, compounds and buildings, the colour-coded floor plan of units, the price list, interested leads and contracts on the sales side, and the timeline, site reports, contractors, budget and cash flow on the construction side. The project manager works inside the project; management can move between projects and compare them.
Gantt timeline: milestones and dates
A Gantt chart lays out the project's milestones as bars on a calendar: excavation, foundations, structure per building, finishing, external works, handover. It answers "what should be happening now, and what comes next?" Its value is in keeping dates visible and agreed. When a milestone slips, everyone sees which later milestones it pushes, including the delivery dates promised in sales contracts.
Work plan and S-curve: are we ahead or behind?
A Gantt shows dates, but not how much work is really done. For that, developers use a work plan with weights, and plot cumulative planned progress against cumulative actual progress. Because work starts slowly, peaks in the middle and slows at finishing, the planned line looks like an S, hence the name. When the actual line falls below the planned line, the project is behind, and the gap shows by how much. Reviewing the S-curve every month turns "the contractor says we are fine" into a number.
Daily site reports with photos
The site engineer submits a daily report: what was done, where, and photos. Over a month, these reports become the record of the project. They support the actual progress on the S-curve, they help review contractors' certificates, and they give management a view of the site without driving there. They also replace the long chain of WhatsApp photos that nobody can search a year later.
Contractors and payment certificates
Most construction is done by contractors who are paid against payment certificates (in Egypt usually called mostakhlasat) for work completed. Each contractor should have a record with their scope and every certificate submitted and paid. Linking certificates to the project means the total paid to each contractor, and what is still due, is always visible, and it feeds directly into the project's actual cost.
Budget against actual, and cash flow
Budget against actual compares what each item was expected to cost with what has been spent so far. The table below is an illustrative example of the view management needs.
| Budget item (illustrative example) | Budget (EGP) | Actual to date (EGP) | Note |
|---|---|---|---|
| Excavation and foundations | 18,000,000 | 18,600,000 | Over by 600,000 |
| Concrete structure | 42,000,000 | 27,500,000 | In progress |
| Finishing | 35,000,000 | 0 | Not started |
| External works and landscaping | 9,000,000 | 0 | Not started |
A cash flow over the next two years adds time to the picture: actual inflows and outflows for past months, and a forecast for the coming ones. On the inflow side, the installments already scheduled in sales contracts give the forecast a solid base; see how payment plans are built. On the outflow side sit contractors' certificates and other project costs. When a month shows more going out than coming in, management knows early enough to adjust the work plan, push a sales campaign or arrange funding.
Separate files vs a project portal
| Question | Excel, folders and WhatsApp | Project portal in a developer system |
|---|---|---|
| What milestone are we on? | Project manager's timeline | Gantt timeline per project |
| Are we ahead or behind? | Opinion | S-curve of planned against actual |
| What happened on site today? | WhatsApp photos | Daily site report with photos |
| What do we owe each contractor? | Certificates in a folder | Contractors and payment certificates |
| Which items are over budget? | Monthly finance update | Budget against actual |
| Will cash cover next months? | Separate forecast sheet | Cash flow, actual and forecast |
If your project files already look like the left column, our article on when spreadsheets stop being enough may help you plan the move.
How Nilex helps
In the complete developer package of Nilex's real estate developer management system, every project has its own portal: progress, a Gantt timeline of milestones, a work plan with an S-curve of planned against actual progress, daily site reports with photos, contractors and their payment certificates, budget against actual per item, and a 24-month cash flow, actual and forecast. The same system runs the CRM, sales, payment plans and collections, so construction and sales are read from one set of numbers. The complete package also includes data migration from your current files and priority support, and integration with your accounting or other systems can be added for you. See the plans on the system page, read the series pillar on real estate developer management systems, and compare running costs using our guide to total cost of ownership.
Frequently asked questions
What is an S-curve in construction?
A chart of cumulative progress over time, planned against actual. The gap between the two lines shows whether the project is ahead of or behind plan.
Who writes the daily site reports?
Usually the site engineer, with photos. Management reads them from the project portal instead of waiting for a weekly meeting.
How far ahead does the cash flow look?
The system shows a 24-month cash flow, actual and forecast.
Is construction tracking in every package?
No. Project execution is in the complete developer package. Smaller packages cover CRM, sales and collections.
Can we follow several projects at once?
Yes. Projects are unlimited, and each has its own portal.
If you want to see construction and sales in one place, talk to Nilex.
 What Makes a Business System Professional: The Standards Nilex Builds Into Its Systems11 October 2026 · 11 min
 A Portal for Every Role: Why Nilex Systems Give Owners, Staff, Technicians and Customers Their Own Screens11 October 2026 · 9 min
 The Nilex Client Portal: Follow Your Project, Invoices, Payments and Requests in One Place11 October 2026 · 8 min